Uploading Your RASON Model to TableauStarting with V2019, RASON includes the ability to turn your based optimization, simulation, data science or decision table model into a Tableau Dashboard Extension, with just a few mouse clicks! Tableau is an industry leading desktop or cloud-based interactive business intelligence tool that centers on data visualization, dashboarding and data discovery. To start, simply designate rows or columns of data to serve as changeable parameters, then choose Create App – Tableau on the Editor page on www.RASON.com and save the file created by the RASON Server. In Tableau, you’ll see the newly-created file under Extensions on the left side of the dashboard, where you can drag it onto your dashboard. You’ll be prompted to match the parameters your model needs with data in Tableau. What you get isn’t just a chart – it’s your full optimization or simulation model, ready to accept Tableau data, run on demand (using our RASON server) and display visual results in Tableau! In order to use this new feature in Analytic Solver, you must first install Tableau V2018.2 or later or open the free cloud based version of Tableau. For more information on this business intelligence tool, see the following website. Solving RASON Models in TableauIn this section, we will create a custom Tableau Extension using the Product Mix example model. Log on to www.RASON.com and then click on the Editor tab. Click the Rason Examples folder (on the top right) and then Optimization With Data Binding -- ProductMixCsv4 from the list. For a complete description of this model, see the Defining your Optimization Model chapter that appears previously in this guide. In order to create an Extension in Tableau, your RASON model must be formulated using an index set. The example code below creates two ordered sets, part and prod. The part set contains five items (in order as entered): chas, tube, cone, psup, and elec while the prod set contains 3 items: tv, stereo, and speakers. An indexSet is always defined as a JSON object{}. For more information on index sets, see the Rason Reference Guide. The example code below uses the dataSources section to create three datasources, parts_data, invent_data and profit_data; using three CSV files. Any supported file type may be used. As discussed in previous sections, a dataSource allows data to be passed to the RASON Server using an external data file in a supported file type. By using an external data file, we can submit updated data to the RASON Server without having to edit our existing RASON model. For example, imagine that Purchasing was able to obtain a discount on Speakers and our inventory increased from 800 to 1,000. If we were not using an external data file, we would have to edit the RASON model directly to reflect this change.
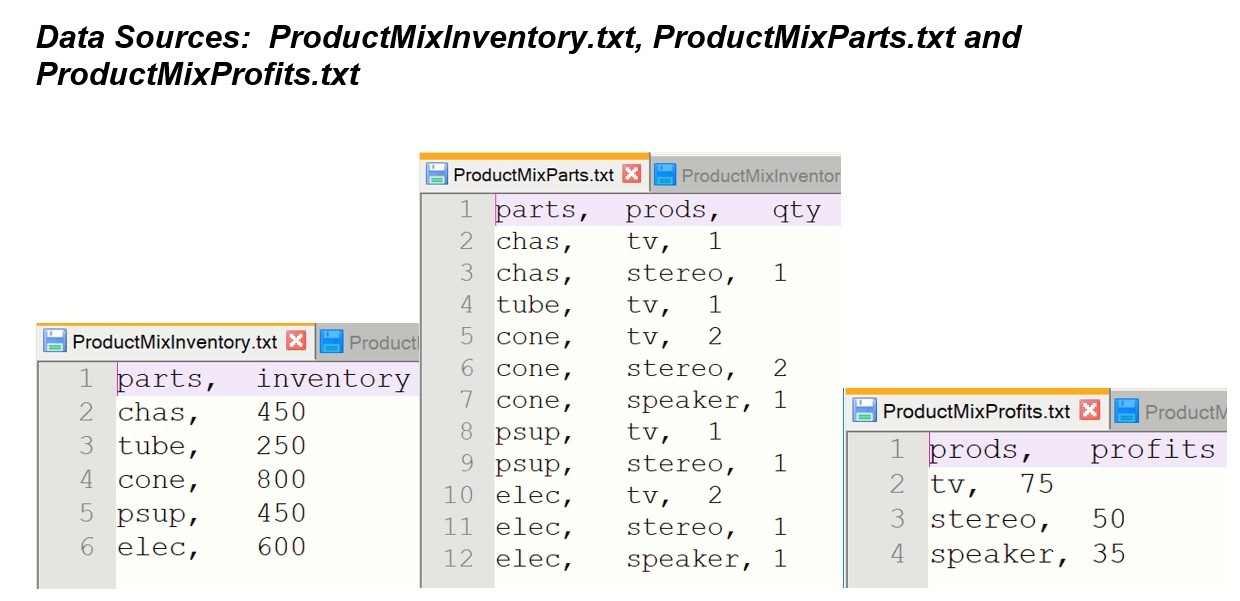
DataSourcesThe last two data sources, invent_data and profit_data, include one indexCol and one valueCol. The indexCol is the column containing the indices or the labels and the valueCol is the column containing the values for the indices. The third data source, parts_data, contains two index columns, parts and products, i.e., a LCD TV requires 2 Electronic components. DataIn the data section, "profit" is bound to the column "profits" within the data source, "profit_data", "parts2" is bound to the "qty" column within the "parts_data" datasource and "invent" is bound to the "inventory" column within the "invent_data" datasource. The three variables are specified within variables, the constraints are created within constraints (using a Pivot Table) and the objective is computed and maximized within objective. For more information on using a pivot table within Rason, see the Using Tables section that occurs in the chapter, Using Array Formulas, For Loops and Tables in Rason. Click Create App – Tableau to create the Tableau Extension. Save the Tableau extension in a location of your choice. 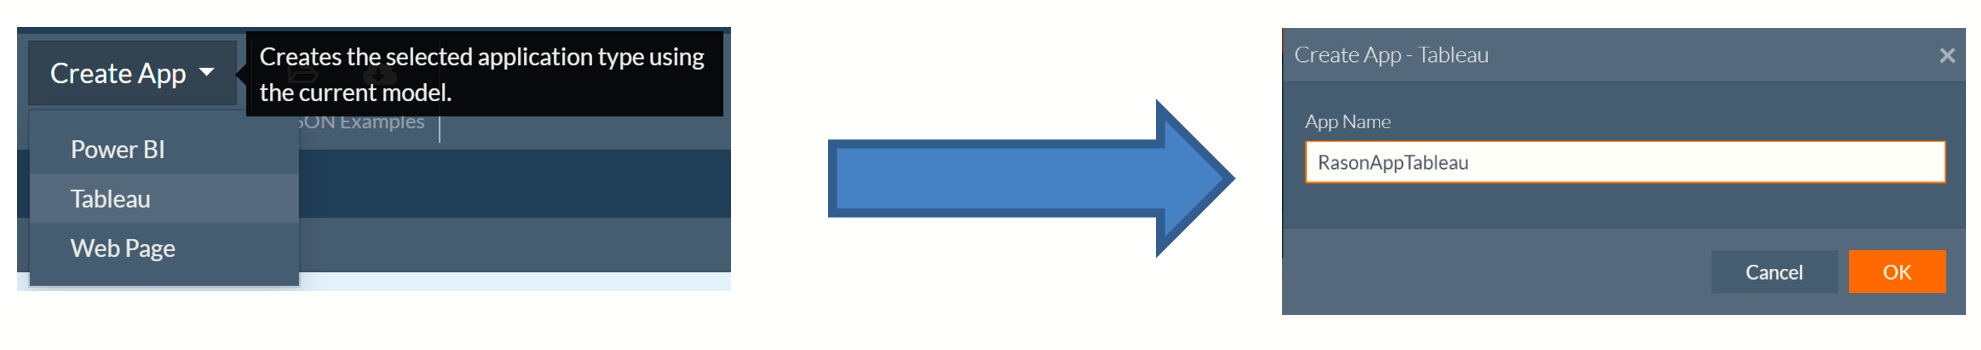
Viewing the Tableau Extension FileOpen File Explorer and browse to the folder where you saved the Tableau extension. Within in that folder will be an Extensions folder. Click that folder and open the Solver.trex file using Notepad. This file contains information such as the extensions name (or how it will appear in Tableau) and the url where the extension is hosted. To publish the html file to a website, simply replace http://localhost:8000 with the desired url. 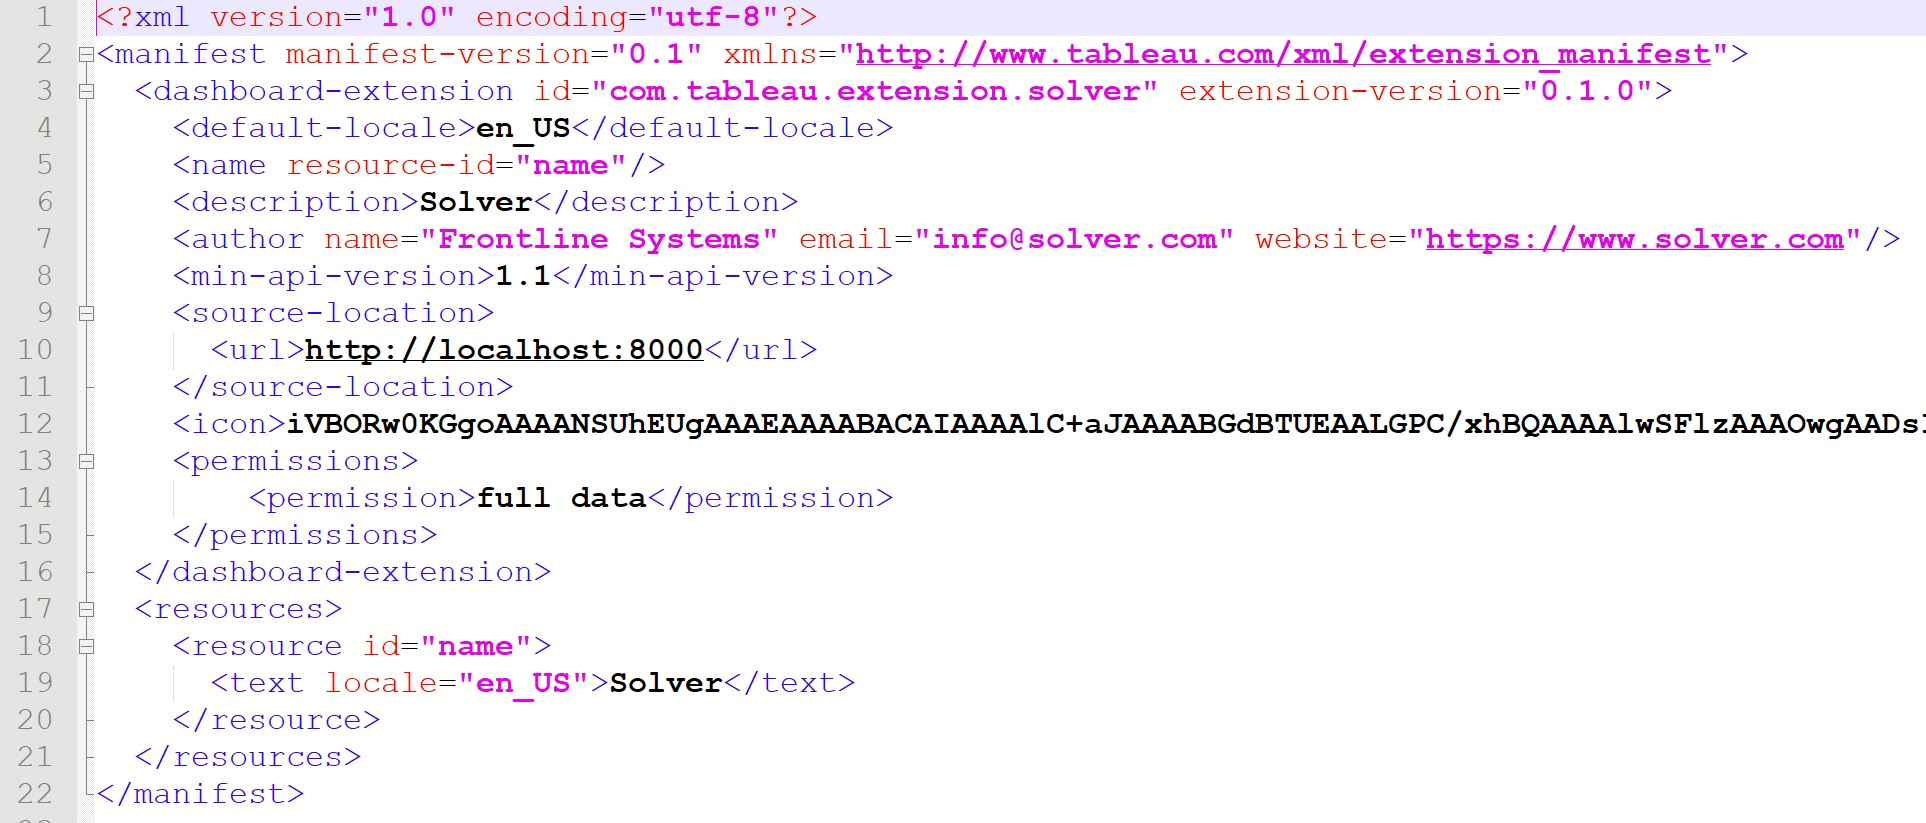
Starting up the ServerSince Tableau extensions are simply web pages, we will first need to start up a web server to serve our content. For this example, we will serve up the webpage to the default location. To do so, open a command prompt, navigate to the root of the extensions repository and run “http-server -p 8000”. 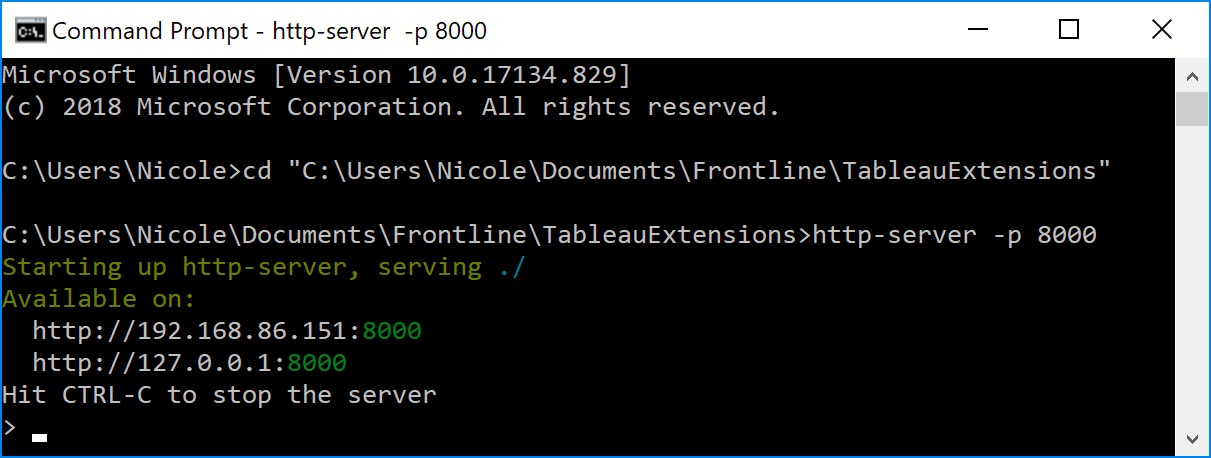
This command starts up a simple http server listening on port 8000. Opening Extensions within TableauOpen either desktop, server or cloud-based Tableau. The screenshot below depicts the opening screen of desktop Tableau. Click Text File under Connect. 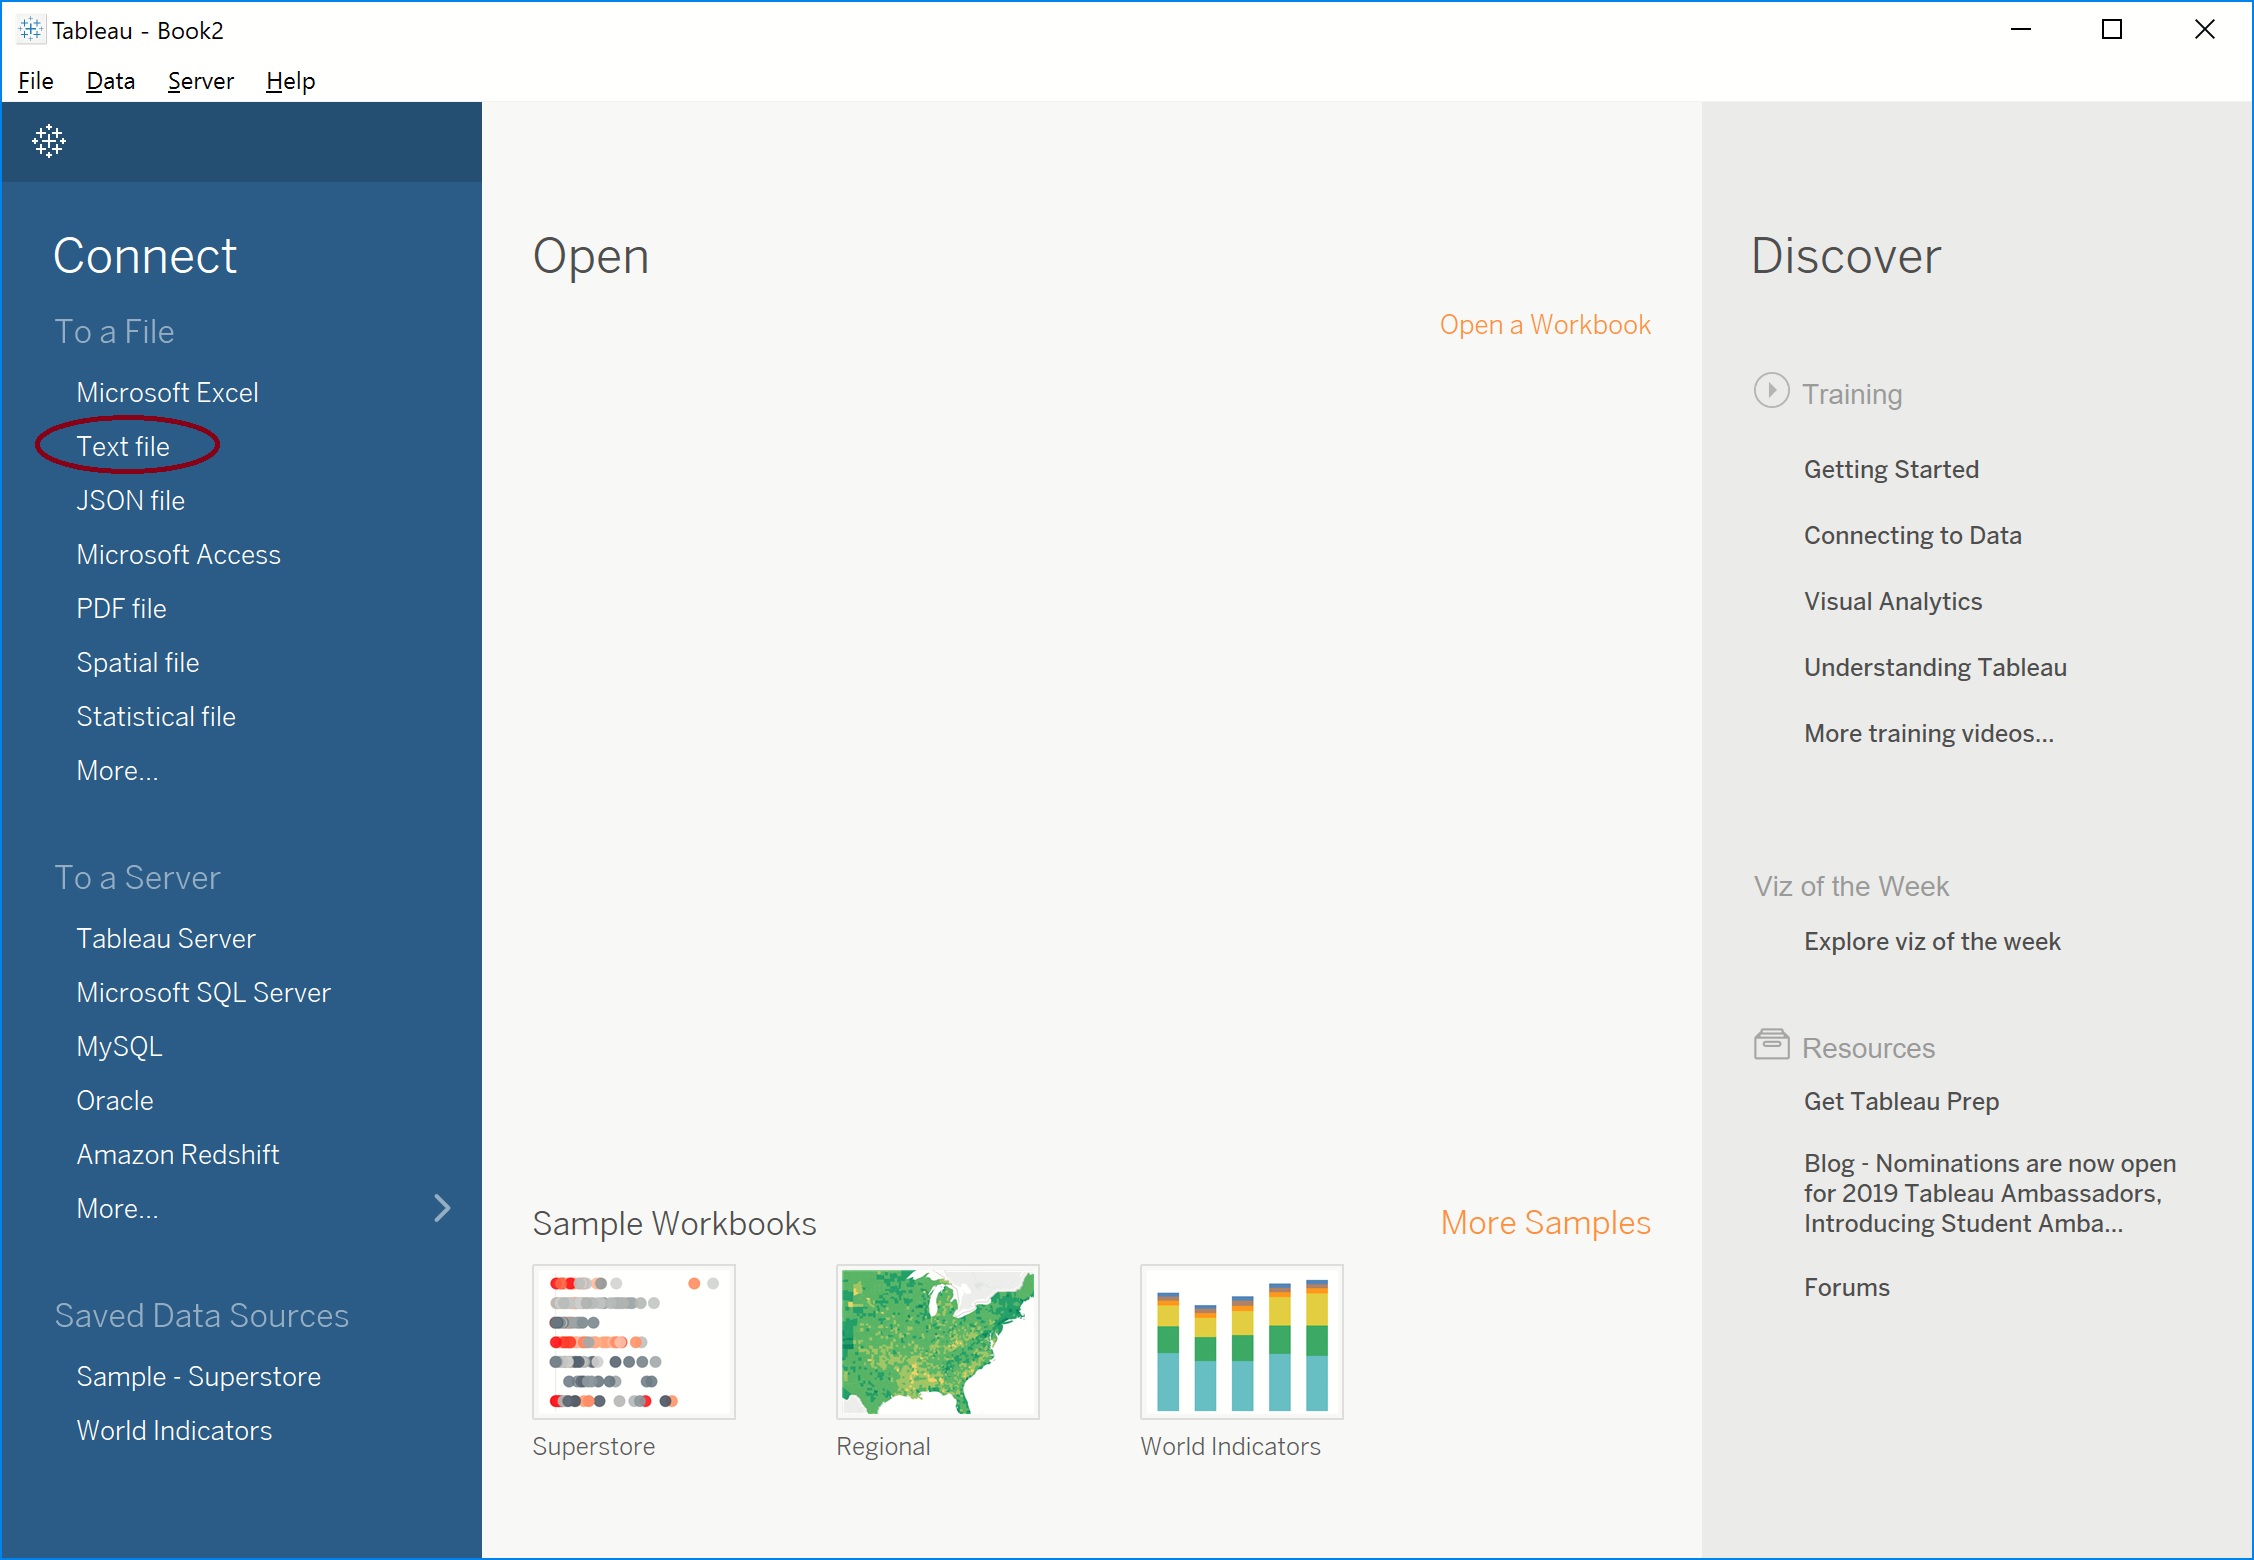
An Open dialog opens. Browse to the location of your data file(s) and click Open. For simplicity's sake, all data has been entered into a single text file for import into Tableau, ProductMixData.txt. A new worksheet, Sheet1, is automatically created. Click on the Sheet 1 tab. 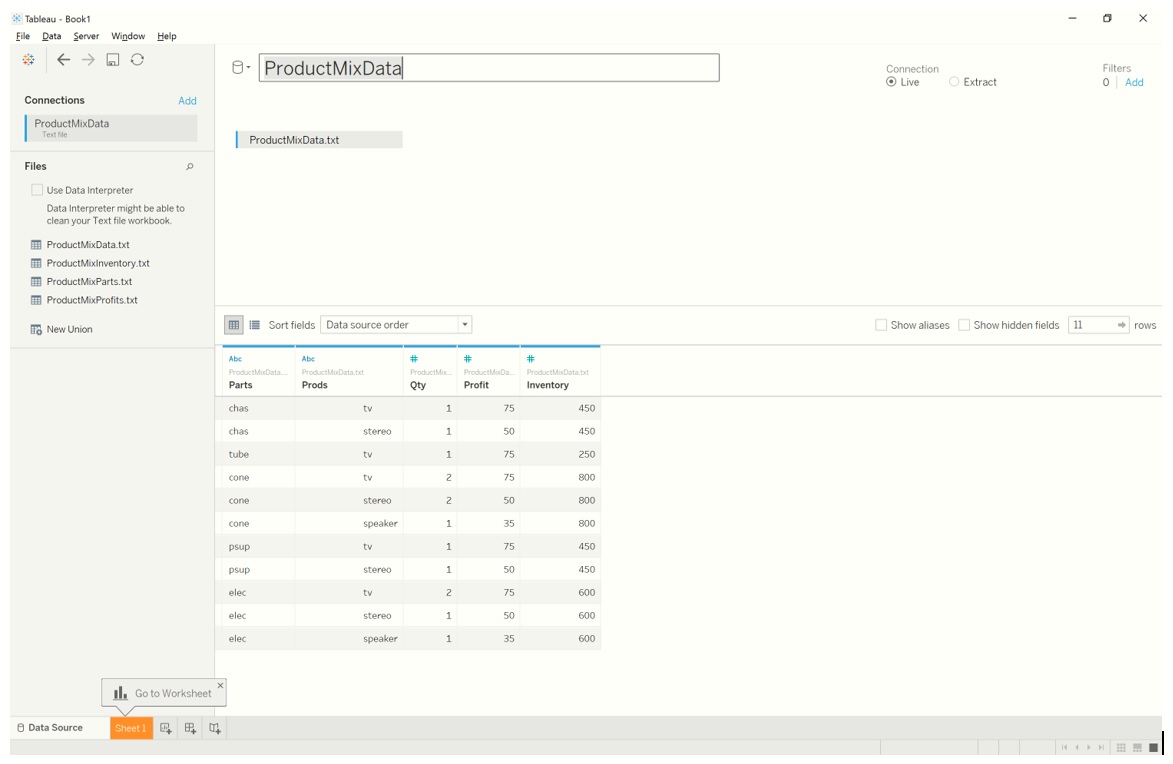
On Sheet 1, drag Parts (under Dimensions) to Sheet 1 rows and then drag Inventory (under Measures) to the values. Important: Hover over Sum(Inventory), click the down arrow that appears to the right, then select Dimensions from the menu. 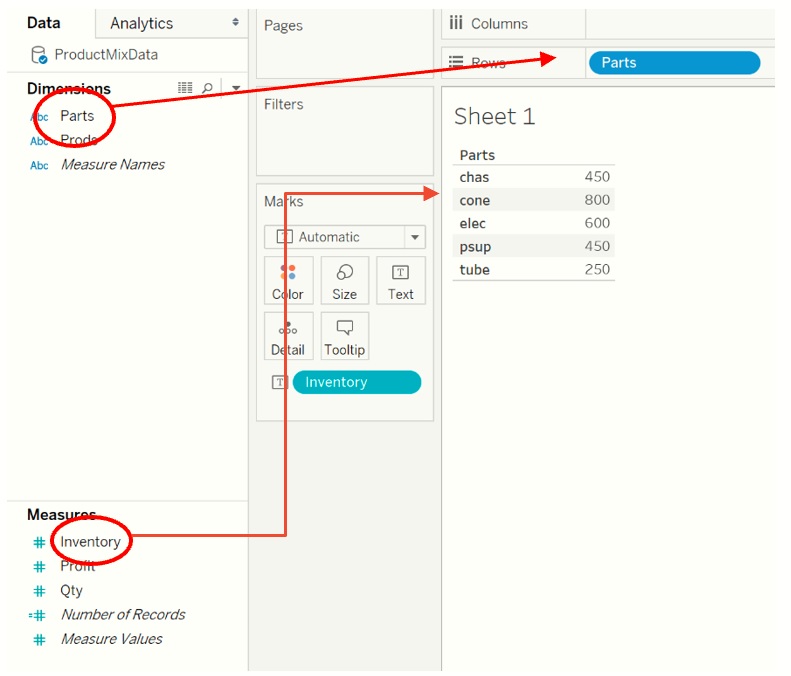
Right click the Sheet 1 tab and rename the worksheet to “Inventory”, then click the New Sheet icon at the bottom of Tableau to open a new worksheet. 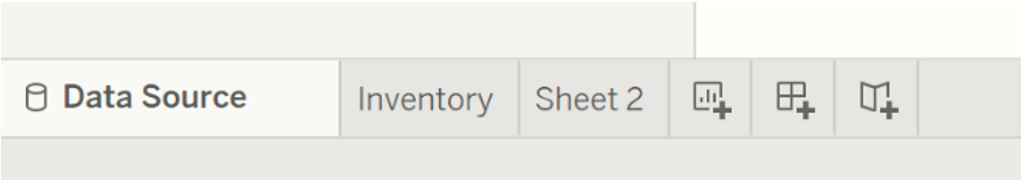
On Sheet 2, drag Prods (under Dimensions) to Sheet 2 columns and then drag Profit (under Measures) to the column values. Hover over Profit, click the down arrow that appears to the right, then select Dimensions from the menu. Rename Sheet2 to Profit and open a new worksheet. 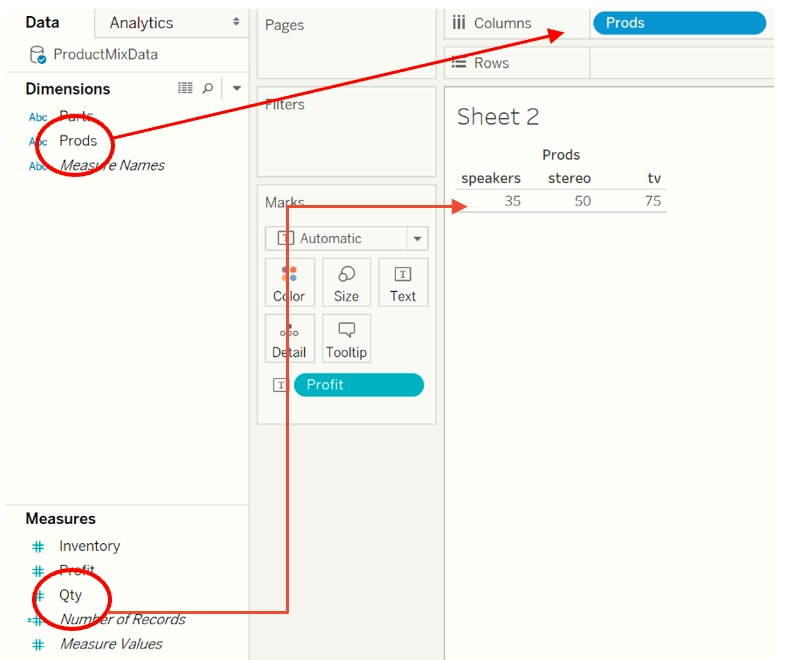
Add a new worksheet and drag “Parts”, under Dimensions, to Rows and “Products”, under Dimensions, to “Columns”. Then drag “RequiredParts”, under Measures, to the field elements. Hover over Qty, click the down arrow that appears to the right, and select Dimensions from the menu. 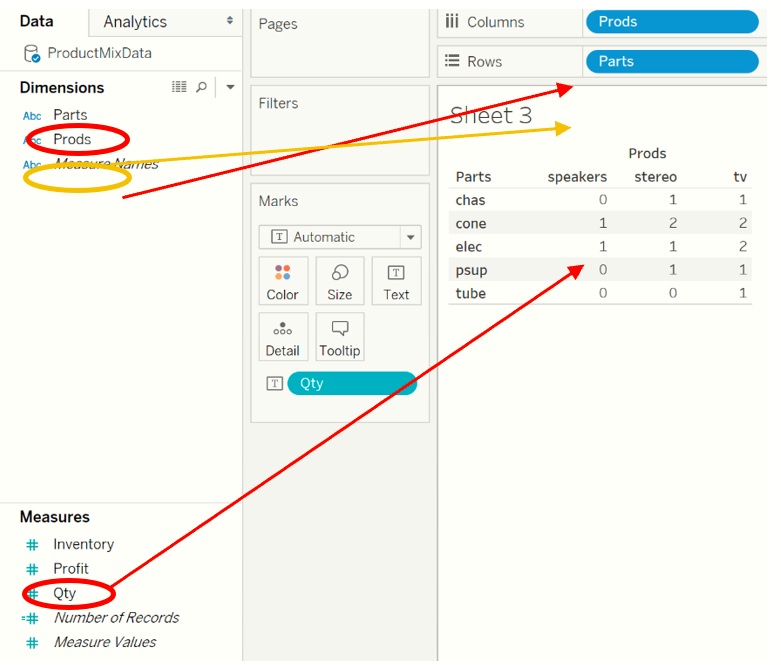
Rename the sheet “Required Parts”. Then create a new dashboard. 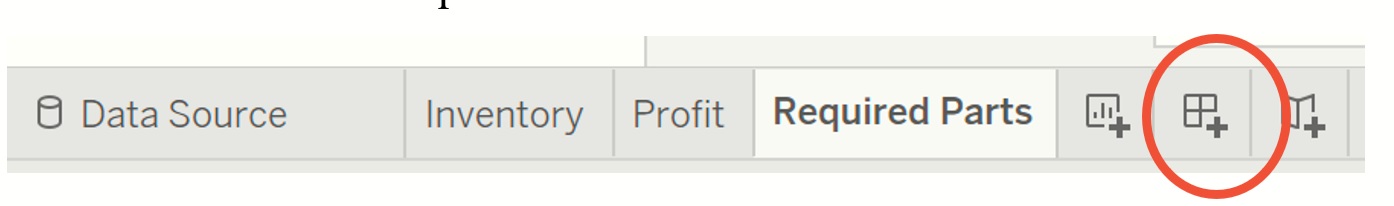
At this point we will connect the dimensions in the Tableau extension with the actual data. Drag all three sheets, Inventory, Required Parts and Profit and a new Extension (under Objects at bottom left) to the canvas. 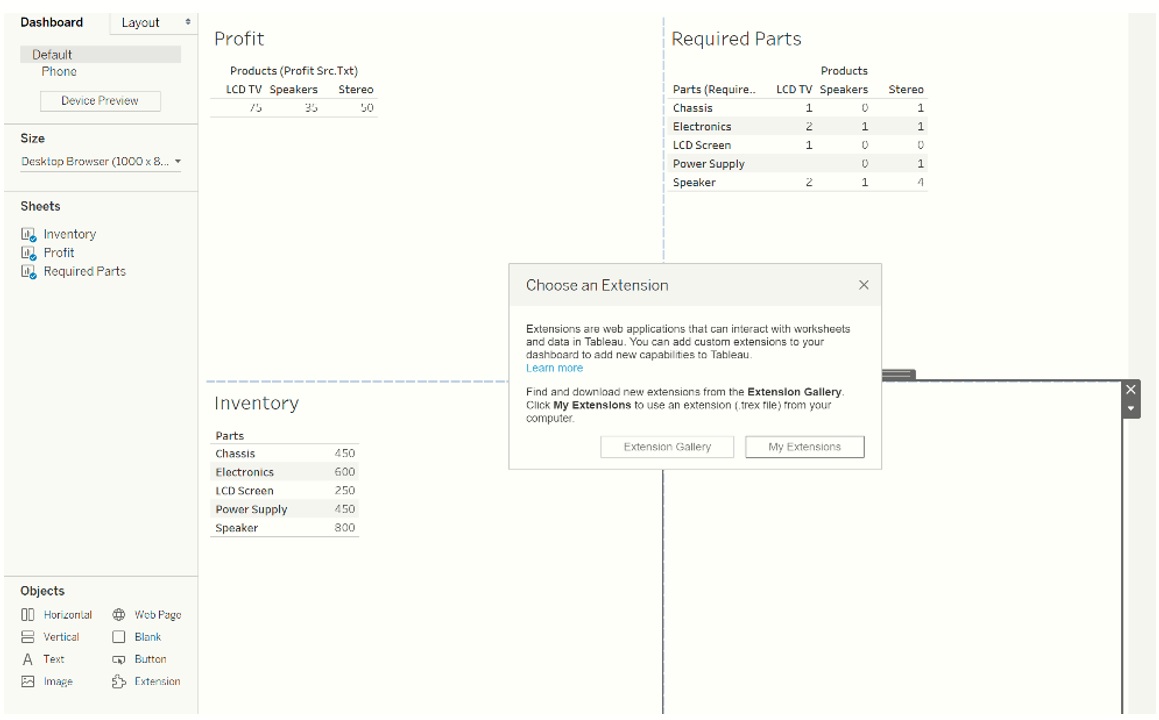
Click My Extensions and browse to the location of the Tableau Extension file (Solver.trex). In this example, the file was saved to the folder, TableauExtensions. Select All Files, then double click the Extensions folder and select the Solver.trex file. 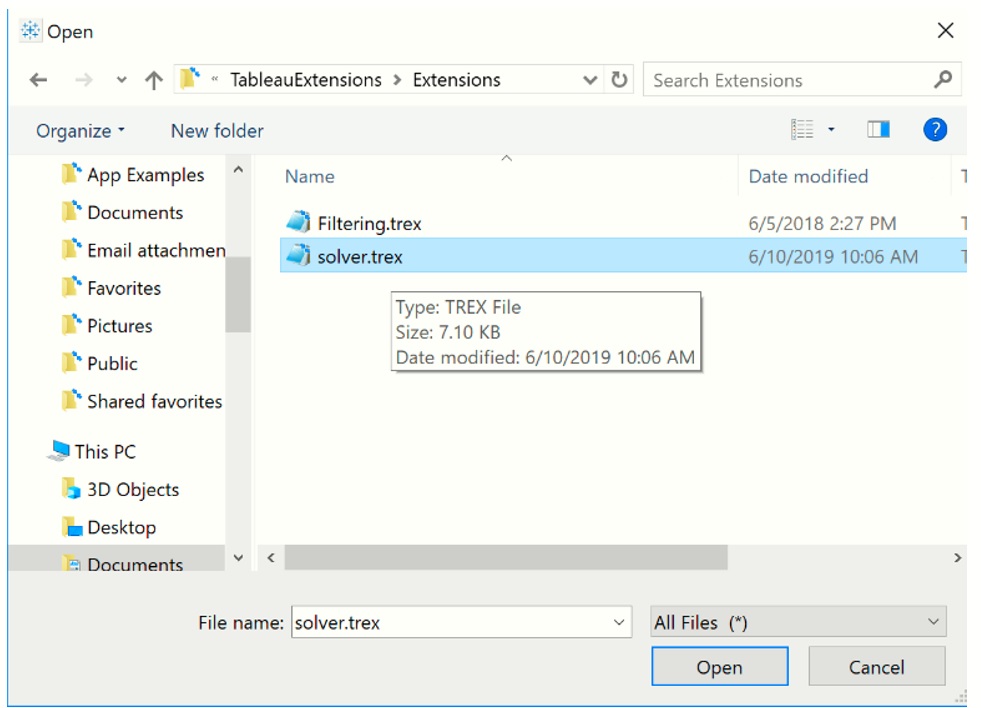
When asked to "Allow Extension", click OK. 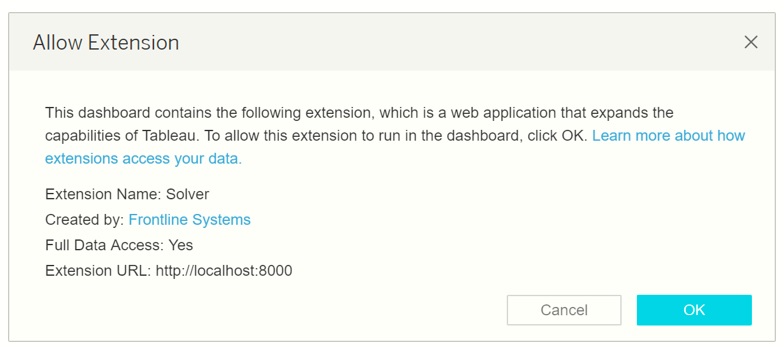
At this point we will connect the dimensions with the actual data. For the first data source, parts, select “Inventory” for Sheet and “parts” for Column to match the “parts” dimension in the CSV file to the “parts” dimension in the Tableau Inventory sheet. Then click OK. 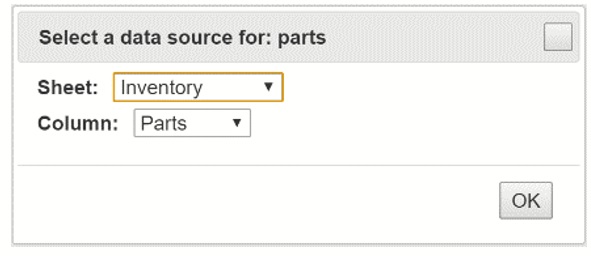
Similar steps must be taken to connect the data with the correct dimension as shown in the table below.
Immediately, the RASON model is submitted to the RASON Server, the model is solved with the LP/Quadratic engine and the final variable values are imported back into Tableau. 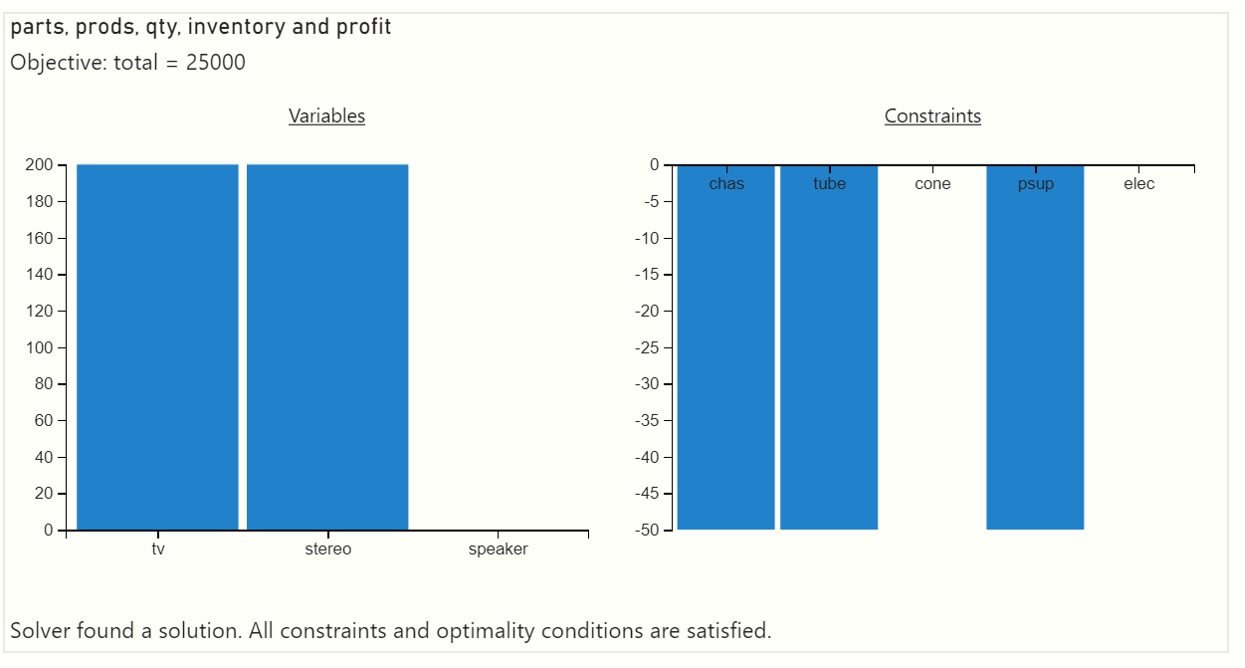
In the chart, we see that final variable values are: Var1 (LCD TV) equal to 200, Var2 (Stereo) equal to 200 and Var3 (Speakers) equal to 0. These variable values result in an objective function value equal to $25,000. At the bottom of the custom visual, we find Solver’s result message: Solver found a solution. All constraints and optimality conditions are satisfied. Recall that since we are solving a linear model, this message indicates that Solver has found the globally optimal solution: There is no other solution satisfying the constraints that has a better value for the objective. For more information on this Solver result, please see the chapter “Solver Results Messages” within the Frontline Solvers Reference Guide. If our data were to change, you would simply need to update the data source, refresh the source within Tableau and watch as the Tableau Extension solved the model using the new data. |