Introduction to RASON
About RASON Models and the RASON Server
Rason Subscriptions
Rason Web IDE
Creating and Running a Decision Flow
Defining Your Optimization Model
Defining Your Simulation Model
Performing Sensitivity Analysis
Defining Your Stochastic Optimization Model
Defining Your Data Science Model
Defining Custom Types
Defining Custom Functions
Defining Your Decision Table
Defining Contexts
Using the REST API
REST API Quick Call Endpoints
REST API Endpoints
Decision Flow REST API Endpoints
OData Endpoints
OData Service for Decision Flows
Creating Your Own Application
Using Arrays, For, Loops and Tables
Organization Accounts

Using OData in Power BI

This simple example illustrates how one could use results saved in OData format to create a chart or graph in Power BI.

  1. Open Power BI
  2. On the Power BI ribbon, click Get Data – Blank Query; the Power Query Editor will appear.
  3. Within the Power Query Editor, click View – Advanced Editor

    Since Power BI does not currently provide a way to specify headers, M code must be used. Copy and paste the following M code into the Advanced Editor dialog.

          
        let
        url="https://rason.net/odata/result",
        modelID="<your resource="" ID="" here="">
          ",
          token="Bearer <your token="" here="">
            ",
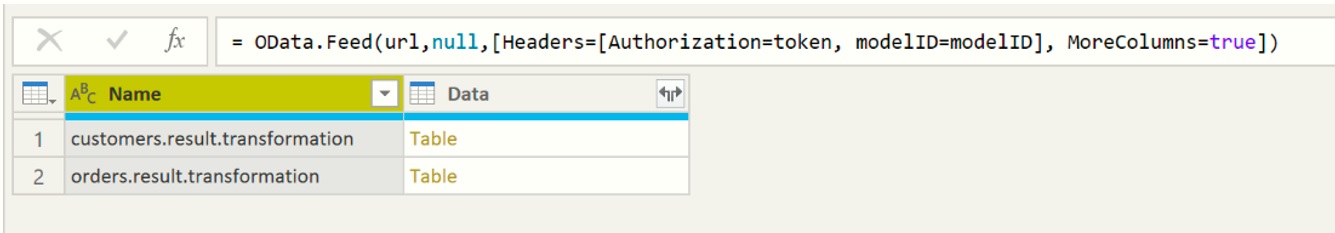
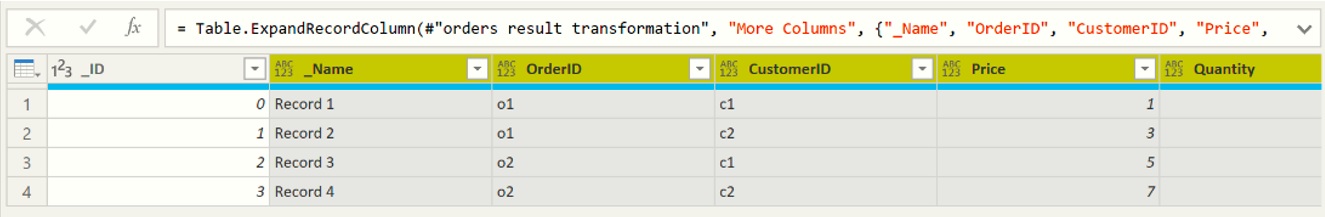
            Source = OData.Feed(url,null,[Headers=[Authorization=token, modelID=modelID], MoreColumns=true]),
            in
            Source


    URL: Any valid RASON OData endpoint may be substituted for the current URL.

    modelID: You can find the resource ID using the RASON Rest API endpoint: GET rason.net/api/model/id.

    token: You can find your token by logging on to RASON.com and clicking MyAccount. (SeeAPI Authoriziation on the MyAccount page.)

    Power BI Advanced Editor

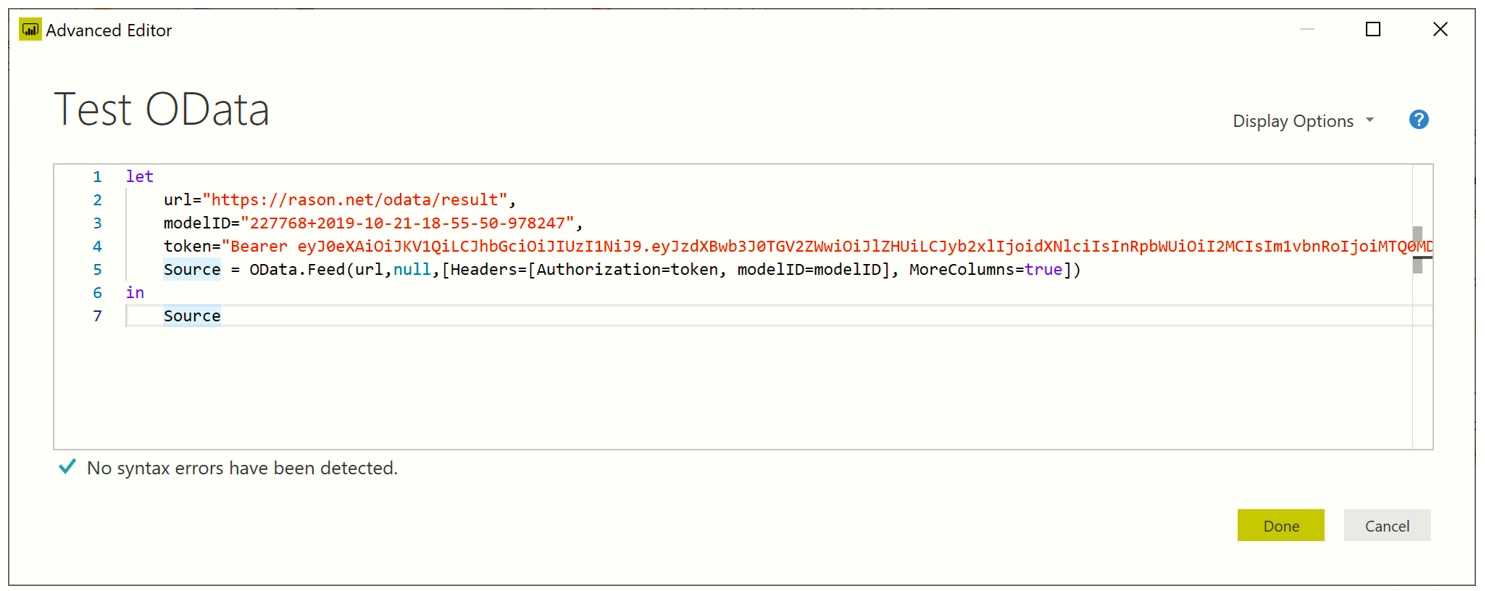
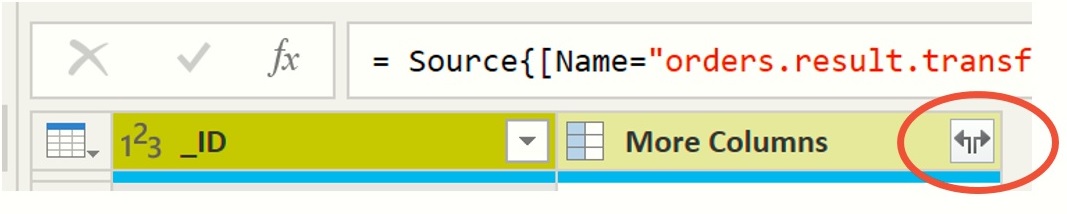
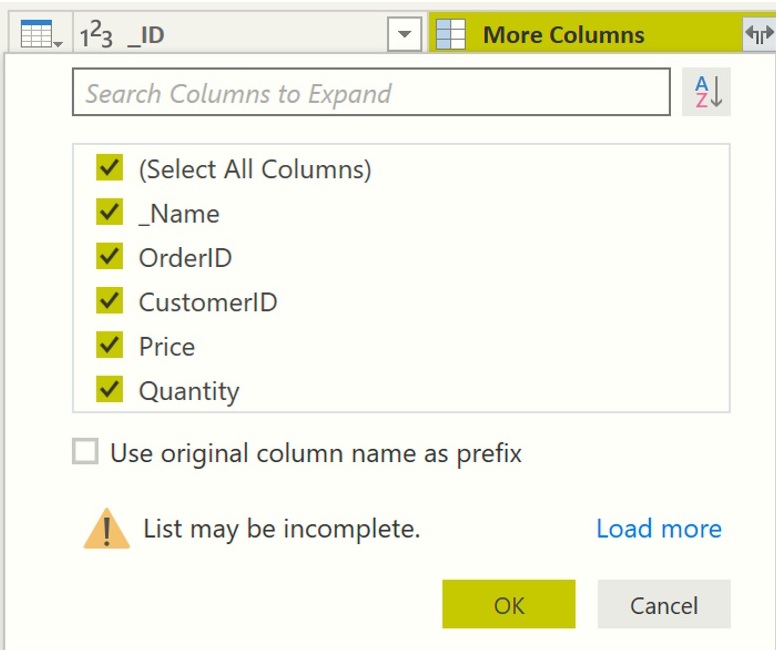
    Note that "MoreColumns=True" is required for "Source" in order to see the related open type entities. By default, this setting is false. Setting this parameter to True is equivalent to checking "Include Open Type Columns" checkbox within the OData Feed dialog.

  4. Click Done. Power BI will connect to the RASON Server's OData feed and pull the requested results. OData Tables in Power BI
    • To view each table, click "Table" under the Data column.

      Table 1 customers.result.transformation

      Viewing OData Tables Content

      Table 2 orders.result.transformation

      OData Tables in Power BI
    • Click "Record" under More Columns (in either table), to see that instance of data. OData Tables in Power BI

      Click the Expand button to the right of More Columns to expand the fields.

      Expand Table

      Uncheck "Use original column name as prefix".

      Column List Dialog

      Then click OK.

      OData Tables in Power BI
  5. Click "Close and Apply" in the Power Query Editor. The data will now be available on the Power BI dashboard. For example, click Map under Visualizations and then drag "Country" under Fields on the right to "Location" on the left. Visualizations tab

    To produce the simple map below.

    Power BI Map showing results
Back to Paging